Most people can tell you how much they earn. Very few can tell you, with any real accuracy, how much they spend and where it actually goes.
That gap between what you think you spend and what you really spend is where financial plans fall apart. It’s the reason budgets feel restrictive, savings goals stall, and the end of the month always arrives before the money runs out.
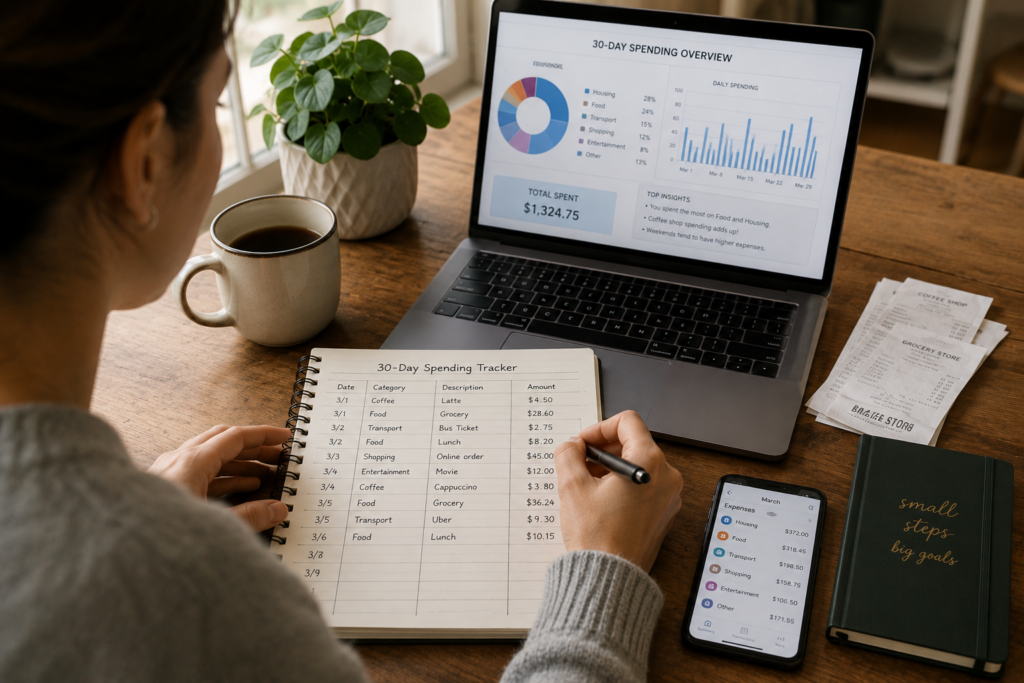
A 30-day spending tracker closes that gap. No budgeting required, no apps you need to pay for, no drastic lifestyle changes. Just honest observation.
This guide walks you through exactly how to do it, what to watch for along the way, and what to do with the data once you have it.
Why 30 Days Is the Right Timeframe
A week is too short. You might catch a grocery run but miss rent. You’ll see weekday habits but skip a weekend splurge. Seven days gives you a snapshot, not a picture.
Ninety days is too long. Motivation fades, tracking gets sloppy, and you start “forgetting” to log the purchases you feel guilty about. Three months of data is great in theory, but most people abandon the effort after three weeks.
Thirty days hits the sweet spot for three reasons:
It captures a full financial cycle. One paycheck (or two), one rent payment, one round of recurring bills, a handful of social events, and a couple of unexpected costs. That’s enough to see a real pattern.
It’s short enough to maintain focus. You can push through the tedious moments because the end is always visible. Thirty days requires discipline, not a personality overhaul.
It aligns with how we think about money. Monthly bills, monthly income, monthly subscriptions. Your brain already organizes finances in 30-day blocks, so tracking in the same unit feels natural.
What You’ll Need Before You Start
The setup takes about 10 minutes. Here’s everything:
A tracking method. Pick one and commit. You’ll have four main options (covered in detail below): a notes app, a spreadsheet, a dedicated expense tracking app, or pen and paper. The best method is whichever one you’ll actually use every single day.
Your starting account balances. Write down the current balance of every account you spend from: checking accounts, savings accounts, credit cards, Venmo, PayPal, Cash App. This gives you a reference point to cross-check your tracking accuracy at the end.
A start date. Don’t wait for the first of the month. If today is the 14th, start on the 14th. Waiting for a “clean” start date is a stalling tactic your brain uses to delay uncomfortable action.
A two-minute daily commitment. That’s all this takes. Two minutes at the end of each day to log what you spent. If you can scroll social media for 20 minutes before bed, you can track expenses for two.
The Four Best Tracking Methods (Pick One)
Method 1: The Notes App (Fastest)
Open the default notes app on your phone. Create a new note titled “30-Day Spending Tracker.” Each day, add the date and list every purchase with the amount.
Example:
June 12
- Gas: $42.00
- Iced coffee: $5.75
- Amazon order (phone charger): $12.99
- Grocery store: $67.34
Pros: Zero setup, always in your pocket, takes 30 seconds per entry.
Cons: No automatic totals, no categories, harder to analyze at the end.
Best for: People who want the lowest barrier to entry and will do a manual review at the end of the month.
Method 2: The Spreadsheet (Most Analytical)
Create a simple spreadsheet in Google Sheets or Excel with four columns: Date, Description, Amount, and Category. Add each purchase as a new row throughout the day.
At the end of 30 days, you can sort, filter, sum by category, and build charts without transferring data anywhere.
Pros: Easy to analyze, sortable, you can add formulas and totals as you go.
Cons: Slightly more effort per entry, requires opening a specific app.
Best for: People who like data, want clean analysis at the end, and are comfortable with basic spreadsheets.
Method 3: The Dedicated App (Most Automated)
Several free apps are built specifically for expense tracking:
- Mint (now Credit Karma) links to your bank accounts and categorizes transactions automatically
- YNAB (You Need a Budget) requires manual entry, which forces mindfulness (free 34-day trial)
- PocketGuard simplifies tracking by showing how much you have left to spend after bills
- Goodbudget uses a digital envelope system
- Wallet by BudgetBakers supports manual and automatic tracking
Pros: Push reminders, automatic categorization, visual breakdowns, historical data.
Cons: Some have paid tiers, linking bank accounts makes some people uncomfortable, automatic tracking can reduce awareness.
Best for: People who want visual dashboards and are comfortable connecting their bank accounts to third-party apps.
Method 4: Pen and Paper (Most Mindful)
Carry a small notebook or index card in your wallet. Every time you make a purchase, write it down immediately, before you put your card or cash away.
This is the oldest method, and many financial coaches still consider it the most effective. The physical act of writing each purchase creates a moment of friction that builds spending awareness faster than any app.
Pros: Maximum awareness, no tech needed, deeply personal.
Cons: Easy to lose, harder to analyze, requires carrying it everywhere.
Best for: People who want the psychological impact of confronting each purchase in real time.
How to Track: The Daily Process
Whatever method you choose, the process is the same. Follow these five rules for 30 days:
Rule 1: Log everything. Every dollar. Every cent. The $1.50 vending machine snack, the $3 parking meter, the $0.99 app purchase. Small transactions are where the biggest surprises hide. If money left your possession, it gets logged.
Rule 2: Log it the same day. Memory fades fast. If you wait until the weekend to log Monday’s spending, you’ll miss things. Set a daily reminder on your phone for 9 p.m. (or whenever your spending day is done) and spend two minutes catching up.
Rule 3: Include cash spending. This is where most tracking efforts break down. ATM withdrawals don’t tell you what you spent the cash on. If you pull out $60, track where every dollar of that $60 goes. If cash tracking feels impossible, switch to card-only spending for the 30 days so every transaction has a digital record.
Rule 4: Don’t change your behavior (yet). This is a fact-finding mission, not a diet. If you normally buy lunch out three times a week, keep doing it. If you usually grab a coffee every morning, grab it. The goal is to capture your real spending patterns, not an artificially restrained version of them. You’ll make changes after you have the data.
Rule 5: Assign a category to each purchase. Even if it’s rough. Use simple labels like: Housing, Food (groceries), Food (eating out), Transportation, Subscriptions, Entertainment, Shopping, Health, Personal Care, and Miscellaneous. Categories turn a list of numbers into a story about your priorities.
The Categories That Matter Most
Not all spending categories carry equal insight. Here are the ones that consistently reveal the most useful information:
Food and Dining
This is the single most variable spending category for most households. The USDA estimates that a moderate-cost food plan for one adult runs about $300 to $350 per month for groceries alone. Add restaurant meals, takeout, coffee shops, and delivery fees, and the real number often doubles.
Track food spending in two separate buckets: groceries and everything else. The gap between those two numbers shows you how much convenience is costing you each month.
Subscriptions and Recurring Charges
The average person underestimates their subscription spending by 2x to 3x. A 2022 survey by C+R Research found that consumers estimated their monthly subscriptions at $86 but were actually spending $219.
During your 30-day tracking period, flag every recurring charge: streaming services, software, gym memberships, subscription boxes, cloud storage, premium app tiers, membership fees. List them separately. You’ll likely find at least one or two you forgot existed.
Transportation
Between gas, car payments, insurance, maintenance, parking, tolls, and ride-shares, transportation often ranks as the second or third largest expense category. If you live in a city, public transit passes, scooter rentals, and the occasional Uber can add up just as quickly.
Track each transport cost individually. “I spend $200 on gas” is less useful than knowing you spent $200 on gas, $45 on parking, $38 on two Ubers, and $12 on a toll road.
Impulse and Convenience Purchases
These are the purchases that don’t fit neatly into a category. The Amazon order at 11 p.m. The snack at the checkout counter. The “I deserve it” purchase after a long day.
Create a category specifically for these. Call it “Impulse” or “Unplanned.” At the end of 30 days, this number alone can be worth the entire exercise.
What Happens During the 30 Days (Week by Week)
Week 1: The Shock Phase
Almost everyone who tracks spending for the first time reacts the same way: they had no idea they were spending that much on certain things.
The $5 daily coffee doesn’t feel like much. But by day seven, you’ve logged $35, and you can see it heading for $150 by month’s end. The three “quick” DoorDash orders total $78 with delivery fees and tips.
This phase is uncomfortable, and that’s the point. Awareness is the first ingredient of change. Don’t react yet. Just observe and record.
Week 2: The Adjustment Phase
By the second week, something interesting happens: tracking itself starts changing your behavior, even though you told yourself not to change anything.
This is called the Hawthorne Effect. The act of observing a behavior naturally alters it. You’ll catch yourself hesitating before a purchase, thinking “do I want to write this down tonight?” That hesitation is awareness doing its work.
Let it happen. If you naturally start spending less because you’re paying attention, that’s data too. Note the difference between weeks one and two.
Week 3: The Pattern Phase
By day 15 to 20, patterns emerge. You’ll start noticing:
- Which days of the week you spend the most (weekends are common)
- Which emotional states trigger spending (stress, boredom, celebration)
- Which stores or apps you visit most frequently
- Which categories are growing faster than you expected
- Which recurring costs are delivering actual value versus running on autopilot
This is where the exercise shifts from data collection to genuine insight. Start writing down observations alongside your numbers. “Noticed I spend more when I’m tired.” “Three of my five Amazon orders this month were things I forgot I bought by the time they arrived.”
Week 4: The Clarity Phase
The final stretch is where everything clicks. You have nearly a full month of data, clear patterns, and a precise dollar amount for each spending category.
Most people experience one or more of these realizations:
- “I’m spending $X on food delivery, and I could cut that in half without missing it.”
- “My subscriptions total $X, and I actively use maybe three of them.”
- “I had no idea my ‘small’ purchases added up to $X per month.”
- “My fixed costs (rent, insurance, utilities) leave me $X for everything else, and I’ve been spending $Y.”
These realizations are the raw material for every financial decision you’ll make going forward.
How to Analyze Your Data After 30 Days
Once the tracking period ends, set aside 30 to 45 minutes for a proper review. Here’s a step-by-step process:
Calculate Your Total Spending
Add up every dollar you spent over 30 days. Compare this number to your take-home income for the same period. The gap (or lack of one) tells you your current savings rate.
- Spending less than income: You have margin. The question is whether that margin is being saved intentionally or just sitting in checking and slowly leaking.
- Spending equal to income: You’re breaking even. One unexpected expense puts you into debt. There’s no room for error.
- Spending more than income: You’re going backward, funding the gap with credit cards, savings drawdowns, or borrowed money. This is the most urgent situation to address, and now you have the data to address it.
Rank Your Categories by Size
List every category from highest spend to lowest. For most people, the top five will account for 80% or more of their total spending. Those five categories are where you focus your energy.
A typical ranking might look like this:
| Rank | Category | Monthly Total | % of Income |
|---|---|---|---|
| 1 | Housing (rent/mortgage) | $1,400 | 35% |
| 2 | Food (all) | $620 | 15.5% |
| 3 | Transportation | $380 | 9.5% |
| 4 | Shopping/Impulse | $290 | 7.25% |
| 5 | Subscriptions/Entertainment | $185 | 4.6% |
Separate Fixed vs. Variable Costs
Fixed costs stay the same every month: rent, car payment, insurance, minimum debt payments. You can change these, but it takes bigger moves (refinancing, moving, switching providers).
Variable costs change based on your choices: food, entertainment, shopping, personal care. These are where quick wins live.
Calculate what percentage of your income goes to each. If fixed costs consume more than 50 to 60% of your take-home pay, the path forward likely involves increasing income or restructuring your fixed obligations (finding a roommate, refinancing debt, shopping for cheaper insurance).
Identify Your Top Three “Leaks”
Leaks are spending areas where the money flowing out is disproportionate to the value you’re receiving. Common ones include:
- Subscription stacking: Paying for Netflix, Hulu, Disney+, HBO Max, and Spotify when you realistically watch two services
- Convenience premiums: Paying $15 for delivered food that would cost $5 to make at home
- Forgotten recurring charges: The app you signed up for six months ago and haven’t opened since
- Lifestyle inflation: Spending more on dining, clothes, or experiences because your income went up, without intentionally choosing to
Circle the three biggest leaks. These are your first targets for adjustment.
Calculate Your “Latte Factor”
Financial author David Bach coined this term to describe small, frequent purchases that add up to shocking annual totals. Your 30-day data lets you calculate yours precisely.
Take every purchase under $10 and add them up. Multiply by 12. That’s your annual “small purchase” spending.
For many people, this number falls between $1,200 and $3,600 per year, equivalent to a vacation, three months of car payments, or a solid start on an emergency fund.
This isn’t about shaming yourself for buying coffee. It’s about making conscious choices. If your daily latte brings you genuine joy and you can afford it, keep it. But if half your small purchases are mindless habits you barely remember by evening, that’s information worth having.
What to Do With What You’ve Learned
Data without action is just trivia. Here’s how to turn your 30-day spending log into a working financial plan.
Build a Spending Plan Based on Reality
Traditional budgets fail because they’re based on what you think you should spend, not what you actually spend. Your 30-day data gives you real numbers to work with.
Start with your actual spending in each category. Then adjust:
- Keep categories where spending matches your values and fits your income
- Reduce categories where you’re spending more than the value you receive
- Cut recurring costs that deliver zero value (forgotten subscriptions, unused memberships)
- Add a savings category if one doesn’t exist, treating it as a fixed expense
A spending plan built on real data feels achievable because it’s rooted in your actual life, not a financial guru’s template.
Set One Specific Savings Goal
Your spending data likely revealed at least one area where $50 to $200 per month could be redirected with minimal pain. Assign that money a purpose:
- An emergency fund
- Paying down a specific debt
- A savings target for something you want (travel, a purchase, a career move)
Vague goals (“save more”) fail. Specific goals (“save $150 per month from my food delivery budget to build a $1,000 emergency fund by February”) succeed because they’re measurable, time-bound, and connected to a behavior you’ve already identified.
Automate the Wins
Once you’ve decided where to cut, make the change automatic and immediate:
- Cancel the subscriptions today, not “at the end of the billing cycle”
- Set up an automatic transfer to savings on your next payday
- Delete the delivery apps from your phone if that’s your biggest leak
- Switch to a cheaper phone plan this week
Speed matters. The longer you wait between insight and action, the more likely old habits will absorb the knowledge without changing anything.
Schedule a 90-Day Check-In
Mark your calendar for 90 days from now. On that date, track your spending for one week and compare it to your 30-day data. Ask yourself:
- Did the changes stick?
- Is the savings goal on track?
- Have new spending patterns emerged?
- Do any categories need another adjustment?
One week of tracking every quarter keeps your spending aligned with your intentions without the burden of permanent daily logging.
Common Mistakes to Avoid
Rounding up or down. Log exact amounts. “$42.37” not “about $40.” Rounding creates a gap between your tracker and your bank account, and that gap grows every day. Precision builds trust in your own data.
Skipping “small” purchases. A $2 purchase ten times a week is $80 per month and nearly $1,000 per year. Nothing is too small to track during these 30 days. The small stuff is frequently where the biggest revelations live.
Tracking joint expenses solo. If you share finances with a partner, both of you need to track, or you’ll only see half the picture. Agree on a shared system (a shared Google Sheet works well) and review the data together.
Judging yourself mid-experiment. Guilt and shame are the enemies of this process. If you spent $400 on dining out, that’s not “bad.” It’s a data point. You can decide what to do about it after the 30 days are over. During the experiment, your only job is to record, not react.
Quitting after a missed day. If you forget to log on day 12, don’t scrap the whole project. Check your bank and credit card statements, reconstruct what you can, and keep going. Imperfect data from 28 days is infinitely more useful than no data from zero days.
The Psychology Behind Why This Works
Tracking spending works for the same reason food journals help people eat better and step counters help people move more: measurement creates awareness, and awareness drives behavior change.
Behavioral economists call this the “observation effect.” When we know we’re being watched (even by ourselves), we make more deliberate choices. The simple act of writing down “$14.50, Chipotle” makes the next Chipotle visit a conscious decision instead of an automatic one.
There’s a second mechanism at work too: loss aversion. Humans feel losses about twice as intensely as equivalent gains. When you see your hard-earned money leaving your account in black and white, categorized and totaled, the emotional weight of spending increases. You don’t need more willpower. You need more visibility. The tracker provides it.
A 2019 study published in the Journal of Financial Planning found that people who tracked their spending for at least 30 days were 80% more likely to follow a budget successfully in the following six months compared to those who didn’t track at all. The data itself was less important than the habit of paying attention.
Who Should Do This (and When)
You’re living paycheck to paycheck and don’t know why. If your income should be enough but somehow isn’t, a 30-day tracker will show you exactly where the gap lives.
You recently had a financial change. New job, new city, new relationship, new baby. Any life transition reshuffles your spending. Tracking during the adjustment period prevents new habits from forming unchecked.
You want to start saving but don’t know where to find the money. The tracker finds it for you. Almost everyone discovers at least $100 to $300 in monthly spending they’re willing to redirect once they can see it clearly.
You’re about to make a big financial decision. Buying a house, switching jobs, going freelance, or taking on a major expense. Thirty days of real spending data gives you an accurate baseline for planning.
You haven’t checked in on your spending in over a year. Habits drift. Prices change. Subscriptions accumulate. An annual 30-day tracking period is like a financial physical, catching problems before they become serious.
A Quick-Start Template
If you want to start right now, here’s a minimal template you can copy into a notes app or spreadsheet:
Day 1 — [Date]
Purchase | Amount | Category
---------|--------|----------
         |        |
         |        |

Daily Total: $___

Running Monthly Total: $___
Fill it in for 30 days. That’s the whole system.
You don’t need the perfect app. You don’t need a financial advisor. You don’t need to read three books on budgeting.
You need a way to write things down, the willingness to be honest about what you see, and 30 days.
The money you’re looking for, the savings you keep saying you’ll start, the financial breathing room that feels out of reach, it’s already in your spending. You just can’t see it yet.
Thirty days from now, you will.