Introduction
In today’s digital world, data has become one of the most valuable assets for businesses and organizations. Every interaction, transaction, and process generates data that can provide meaningful insights when analyzed correctly. Data analysis helps organizations transform raw information into valuable knowledge that supports better decision-making, improves performance, and drives growth.
Whether used in marketing, finance, healthcare, technology, or operations, data analysis plays a critical role in understanding trends, identifying opportunities, solving problems, and predicting future outcomes.
This comprehensive guide explores the fundamentals of data analysis, key techniques, tools, methodologies, and best practices for extracting value from data.
What Is Data Analysis?
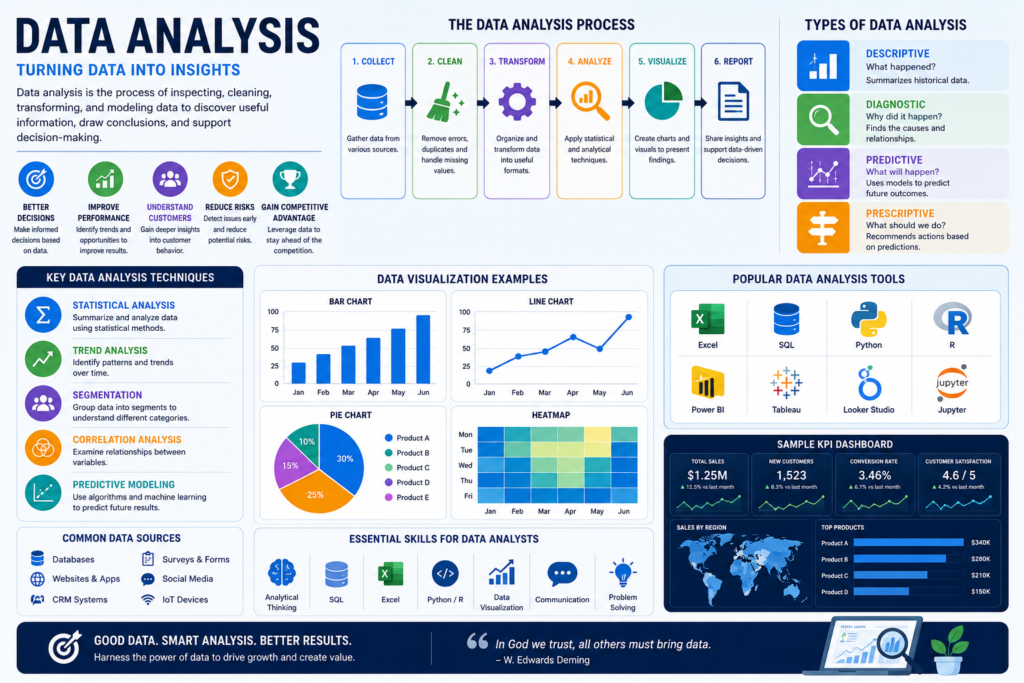
Data analysis is the process of collecting, cleaning, organizing, examining, and interpreting data to uncover useful information, identify patterns, and support decision-making.
The primary goal of data analysis is to convert raw data into actionable insights that help organizations achieve their objectives.
Data analysis typically involves:
- Data collection
- Data cleaning
- Data transformation
- Statistical analysis
- Data visualization
- Reporting and interpretation
Why Data Analysis Matters
Better Decision-Making
Organizations can make informed decisions based on evidence rather than assumptions.
Improved Efficiency
Data analysis identifies inefficiencies and opportunities for process optimization.
Enhanced Customer Understanding
Businesses gain deeper insights into customer behavior, preferences, and needs.
Risk Reduction
Analytics help identify potential risks before they become significant problems.
Competitive Advantage
Organizations that effectively leverage data often outperform competitors.
Types of Data Analysis
Descriptive Analysis
Descriptive analytics answers the question:
“What happened?”
Examples include:
- Sales reports
- Website traffic summaries
- Monthly performance dashboards
Diagnostic Analysis
Diagnostic analysis investigates:
“Why did it happen?”
This involves identifying causes behind specific outcomes.
Predictive Analysis
Predictive analytics uses historical data and statistical models to forecast future events.
Examples include:
- Sales forecasting
- Customer churn prediction
- Demand planning
Prescriptive Analysis
Prescriptive analytics recommends actions based on predictive insights.
Examples include:
- Pricing optimization
- Marketing recommendations
- Resource allocation strategies
The Data Analysis Process
1. Data Collection
Data can be gathered from various sources, including:
- Databases
- Surveys
- Websites
- Mobile applications
- CRM systems
- Social media platforms
- IoT devices
2. Data Cleaning
Raw data often contains errors, duplicates, and inconsistencies.
Cleaning activities include:
- Removing duplicates
- Handling missing values
- Correcting formatting issues
- Standardizing data structures
3. Data Transformation
Data is organized into formats suitable for analysis.
Examples include:
- Aggregation
- Normalization
- Categorization
- Feature engineering
4. Data Analysis
Analysts apply statistical and analytical techniques to identify patterns and relationships.
5. Data Visualization
Visual representations help stakeholders understand findings quickly.
6. Reporting
Insights are communicated through dashboards, reports, and presentations.
Essential Data Analysis Techniques
Statistical Analysis
Statistics provide methods for summarizing and interpreting data.
Common techniques include:
- Mean
- Median
- Mode
- Standard deviation
- Correlation analysis
- Regression analysis
Trend Analysis
Trend analysis identifies patterns over time.
Examples:
- Revenue growth
- Seasonal demand changes
- Customer engagement trends
Segmentation Analysis
Grouping data into categories allows deeper understanding of audiences and behaviors.
Cohort Analysis
Tracks groups of users who share common characteristics over time.
Predictive Modeling
Uses machine learning and statistical algorithms to forecast future outcomes.
Data Visualization
Visualization makes complex data easier to understand.
Popular visualization formats include:
Charts
- Bar charts
- Line charts
- Pie charts
- Area charts
Dashboards
Interactive dashboards provide real-time business insights.
Heatmaps
Heatmaps reveal patterns and concentrations within datasets.
Geographic Maps
Useful for location-based analysis and market research.
Popular Data Analysis Tools
Microsoft Excel
Excel remains one of the most widely used data analysis tools.
Key capabilities include:
- Pivot tables
- Charts
- Data cleaning
- Basic statistical analysis
SQL
SQL enables analysts to query and manage large datasets stored in databases.
Python
Python is a powerful programming language for advanced analytics.
Popular libraries include:
- Pandas
- NumPy
- Matplotlib
- Seaborn
- Scikit-learn
R
R specializes in statistical analysis and data visualization.
Power BI
Microsoft Power BI creates interactive dashboards and reports.
Tableau
Tableau provides advanced visualization and business intelligence capabilities.
Google Looker Studio
Offers cloud-based reporting and dashboard creation.
Business Intelligence and Data Analysis
Business Intelligence (BI) combines data analysis, reporting, and visualization to support organizational decision-making.
BI solutions help businesses:
- Monitor performance
- Track KPIs
- Analyze trends
- Improve forecasting
- Support strategic planning
Big Data Analytics
Modern organizations often manage enormous volumes of data.
Big Data is characterized by:
Volume
Massive amounts of information.
Velocity
Rapid data generation and processing.
Variety
Multiple data formats and sources.
Veracity
Data quality and reliability.
Value
The usefulness of insights derived from data.
Data Analysis Applications
Marketing Analytics
Businesses analyze campaign performance, customer behavior, and conversion rates.
Financial Analysis
Organizations evaluate revenue, profitability, expenses, and investment opportunities.
Healthcare Analytics
Hospitals use data to improve patient outcomes and operational efficiency.
Supply Chain Analytics
Companies optimize inventory, logistics, and forecasting processes.
Human Resources Analytics
HR teams analyze employee performance, retention, and recruitment metrics.
Key Skills for Data Analysts
Successful data analysts require both technical and business skills.
Technical Skills
- SQL
- Excel
- Python
- R
- Data visualization
- Database management
- Statistical analysis
Business Skills
- Critical thinking
- Communication
- Problem-solving
- Decision-making
- Business understanding
Future Trends in Data Analysis
Artificial Intelligence
AI-powered analytics tools automate data processing and insight generation.
Machine Learning
Advanced predictive models continue improving forecasting accuracy.
Real-Time Analytics
Organizations increasingly rely on immediate insights for faster decisions.
Cloud Analytics
Cloud-based platforms offer scalable and cost-effective analytics solutions.
Self-Service Analytics
Business users can perform analysis without extensive technical expertise.
Best Practices for Effective Data Analysis
- Define clear objectives
- Ensure data quality
- Use reliable data sources
- Focus on actionable insights
- Visualize data effectively
- Validate findings
- Continuously monitor performance
- Maintain data security and privacy
Conclusion
Data analysis is essential for organizations seeking to make smarter decisions and gain a competitive advantage. By transforming raw data into meaningful insights, businesses can improve efficiency, understand customers, reduce risks, and uncover new growth opportunities.
As technology continues to evolve, data analysis will become even more important across industries. Organizations that invest in data-driven strategies, analytical tools, and skilled professionals will be better positioned to thrive in an increasingly data-centric world.