The listing looks great. Three-bedroom house in a growing neighborhood, tenant already in place, asking price below market value. Your gut says buy it. The real estate agent says it’s a steal. The seller says it cash flows beautifully.
None of that matters until you run the numbers.
Real estate investing is a math problem disguised as a lifestyle choice. The properties that look exciting on a listing sheet can bleed money for years. The properties that seem boring on paper can quietly generate thousands in monthly cash flow. The difference between a wealth-building asset and a financial anchor comes down to a handful of calculations that most first-time investors either skip or get wrong.
This guide walks through every formula, metric, and calculation you need to evaluate a rental property deal with confidence. We’ll use real numbers, work through complete examples, and show you exactly where deals go bad so you can spot the traps before your money is on the line.
No vague rules of thumb. No “it depends” without showing you what it depends on. Just the math that separates investors who build wealth from investors who subsidize their tenants’ housing.
The Numbers You Need Before You Calculate Anything
Before you plug numbers into formulas, you need accurate inputs. Bad inputs produce bad outputs, and bad outputs lead to bad investment decisions. Here’s every number you need and where to find reliable versions of each.
Purchase Price and Acquisition Costs
The purchase price is obvious. What’s less obvious is the total cost of acquiring the property, which includes several expenses beyond the sale price.
Closing costs typically run 2% to 5% of the purchase price. These include lender fees, title insurance, appraisal fees, attorney fees, recording fees, and transfer taxes. On a $250,000 property, expect $5,000 to $12,500 in closing costs.
Inspection costs run $300 to $500 for a standard home inspection. Add $200 to $400 for specialized inspections (sewer scope, radon, mold, structural) if the property warrants them.
Immediate repair and renovation costs are the expenses needed to make the property rent-ready. A property that needs $15,000 in repairs before a tenant moves in has a true acquisition cost of the purchase price plus closing costs plus that $15,000.
Your total acquisition cost is the number you use in all return calculations, not just the purchase price. Ignoring closing costs and immediate repairs inflates your projected returns and sets false expectations.
Rental Income
Market rent is what a comparable property in the same area rents for today. Not what the seller says it could rent for. Not what Zillow’s rent estimate shows. Actual, verified market rent.
To find reliable market rent data:
- Check active listings on Zillow, Apartments.com, Craigslist, and Facebook Marketplace for comparable properties (same bedroom count, similar condition, same neighborhood) currently listed for rent.
- Check recently rented comps if your market has MLS rental data. Active listings show asking rents. Recently rented comps show what tenants actually agreed to pay.
- Talk to local property managers. They know what properties rent for in specific neighborhoods better than any algorithm. A five-minute phone call gives you better data than an hour of online research.
- Account for your property’s specific condition. A recently renovated property commands higher rent than an identical floor plan with original 1990s fixtures. Be honest about where your property sits relative to the comps.
Vacancy rate is the percentage of time your property will sit empty between tenants. New investors often calculate returns assuming 100% occupancy, which never happens in practice.
Use 5% to 8% vacancy for single-family rentals in strong markets with high demand. Use 8% to 10% for properties in average markets or multi-family properties with more turnover. Use 10% to 15% for properties in weaker markets or less desirable locations.
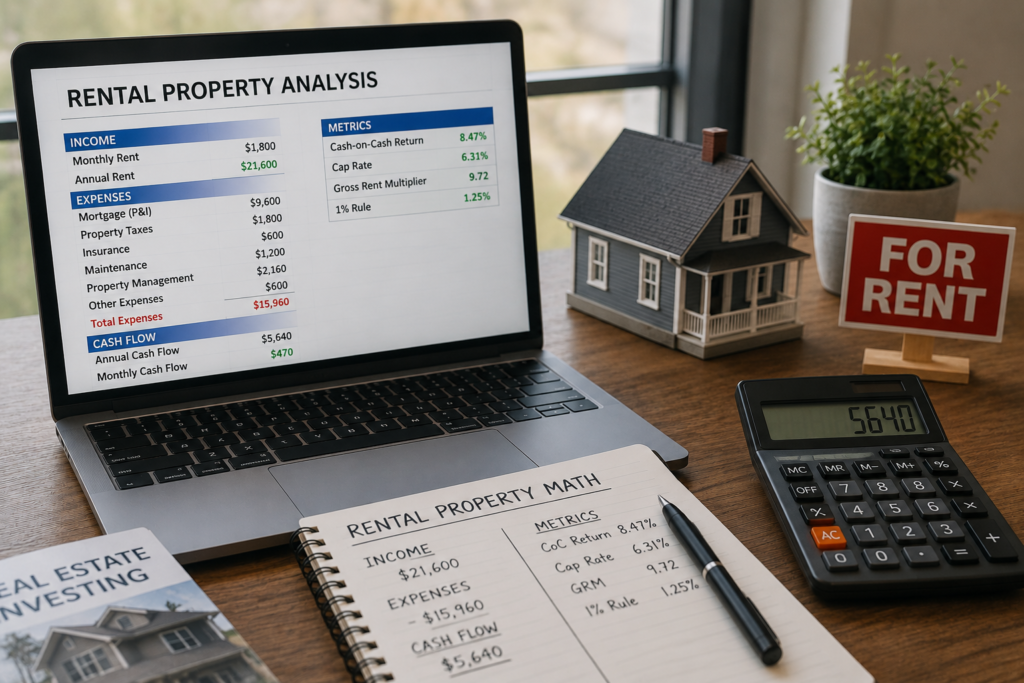
A 5% vacancy rate on a property renting at $1,800 per month means you lose roughly one month of rent per year, reducing your effective annual income from $21,600 to $20,520.
Your effective gross income is:
Monthly rent × 12 × (1 – vacancy rate) = Effective gross income
$1,800 × 12 × (1 – 0.05) = $20,520
Operating Expenses
This is where most beginners underestimate and where most deals fall apart. Operating expenses include every recurring cost of owning and maintaining the property, excluding your mortgage payment.
Property taxes. Check the county assessor’s website for the exact current tax bill. Don’t rely on the seller’s reported taxes, as reassessment after sale can increase the tax bill significantly in some states. Annual property taxes on a $250,000 property might range from $2,500 (in a low-tax state) to $6,000+ (in a high-tax state).
Insurance. Landlord insurance (not homeowner’s insurance) typically costs 15% to 25% more than a standard homeowner’s policy. Get an actual quote from an insurance agent rather than estimating. For a $250,000 property, expect $1,200 to $2,400 annually, depending on location, age, and condition.
Property management fees. Even if you plan to self-manage, include this cost in your analysis. Plans change. Burnout happens. Life gets busy. You need to know the property still makes money when someone else manages it.
Professional property management typically costs 8% to 10% of collected rent for single-family homes and 6% to 8% for multi-family properties. Some managers charge additional fees for tenant placement (50% to 100% of one month’s rent), lease renewals ($100 to $300), and maintenance coordination (markup on repair costs).
On a $1,800/month rental, 8% management equals $144/month or $1,728/year.
Maintenance and repairs. Budget 1% to 2% of the property value annually for ongoing maintenance. A $250,000 property should have $2,500 to $5,000 set aside each year for repairs. Older properties and properties with older systems (HVAC, roof, plumbing) should be at the higher end.
This covers routine repairs: leaking faucets, appliance replacements, minor electrical work, painting between tenants, and general upkeep. It doesn’t cover major capital expenditures (more on those below).
Capital expenditure reserves (CapEx). Big-ticket items have finite lifespans. Roofs last 20 to 30 years. HVAC systems last 15 to 20 years. Water heaters last 8 to 12 years. Appliances last 10 to 15 years.
Budget an additional 5% to 10% of rental income for CapEx reserves. This money accumulates over time to cover the eventual $8,000 roof repair, $6,000 HVAC replacement, or $15,000 kitchen renovation between tenants.
On $1,800/month rent, 8% CapEx reserves equal $144/month or $1,728/year.
HOA fees (if applicable). Condos and some townhome communities charge monthly HOA fees ranging from $100 to $500+. These are fixed costs that directly reduce cash flow. High HOA fees can kill an otherwise promising deal.
Utilities (if landlord-paid). In some rental arrangements, the landlord pays water, sewer, trash, or even heat. If you’re covering any utilities, get actual cost data from the utility company for that specific address.
Lawn care, snow removal, and common area maintenance. If the lease makes you responsible for exterior maintenance, budget accordingly. $100 to $200/month for lawn and snow service is typical in many markets.
Financing Details
If you’re using a mortgage (most investors do), you need exact numbers:
Down payment amount. Investment property loans typically require 20% to 25% down. On a $250,000 property, that’s $50,000 to $62,500. Some loan programs allow 15% down, but you’ll pay higher interest rates and mortgage insurance.
Interest rate. Get a pre-approval or rate quote from a lender. Investment property rates typically run 0.5% to 0.75% higher than primary residence rates. At the time of your purchase, this could mean the difference between a profitable deal and a break-even one.
Loan term. 30-year fixed is standard and gives you the lowest monthly payment, maximizing cash flow. 15-year and 20-year terms build equity faster but reduce monthly cash flow significantly. For most investors optimizing for cash flow, the 30-year term makes more sense.
Monthly mortgage payment (principal and interest). Use a mortgage calculator to get the exact number. On a $200,000 loan (80% of $250,000) at 7% interest for 30 years, the monthly principal and interest payment is approximately $1,331.
The Core Metrics: How Experienced Investors Evaluate Deals
With your inputs gathered, you’re ready to calculate the metrics that tell you whether a deal makes money. Each metric answers a different question, and you need all of them to see the complete picture.
Metric 1: Cash Flow
What it answers: How much money goes into my pocket each month after all expenses are paid?
Cash flow is the most fundamental metric in rental property investing. It’s the money left over after you collect rent and pay every expense, including your mortgage.
Formula:
Monthly cash flow = Gross monthly rent – Vacancy allowance – All operating expenses – Mortgage payment (P&I)
Full example:
Let’s use a $250,000 single-family rental with a $200,000 mortgage at 7% over 30 years.
| Item | Monthly | Annual |
|---|---|---|
| Gross rent | $1,800 | $21,600 |
| Vacancy (5%) | -$90 | -$1,080 |
| Property taxes | -$250 | -$3,000 |
| Insurance | -$150 | -$1,800 |
| Property management (8%) | -$144 | -$1,728 |
| Maintenance (1.5% of value) | -$313 | -$3,750 |
| CapEx reserves (8% of rent) | -$144 | -$1,728 |
| Mortgage (P&I) | -$1,331 | -$15,972 |
| Monthly cash flow | -$622 | -$7,458 |
This deal loses $622 per month. It’s not a good investment at these numbers, regardless of how nice the property looks or how promising the neighborhood seems.
Now let’s adjust the scenario. Same property, but purchased for $200,000 (better deal or different market), with $1,800 rent and a $160,000 mortgage at 6.5%.
| Item | Monthly | Annual |
|---|---|---|
| Gross rent | $1,800 | $21,600 |
| Vacancy (5%) | -$90 | -$1,080 |
| Property taxes | -$208 | -$2,500 |
| Insurance | -$125 | -$1,500 |
| Property management (8%) | -$144 | -$1,728 |
| Maintenance (1.5% of value) | -$250 | -$3,000 |
| CapEx reserves (8% of rent) | -$144 | -$1,728 |
| Mortgage (P&I) | -$1,011 | -$12,132 |
| Monthly cash flow | -$172 | -$1,968 |
Still negative. Still not a good deal, at least not from a pure cash flow perspective.
Let’s try the same property at $200,000 with rent at $2,100/month (a stronger rental market).
| Item | Monthly | Annual |
|---|---|---|
| Gross rent | $2,100 | $25,200 |
| Vacancy (5%) | -$105 | -$1,260 |
| Property taxes | -$208 | -$2,500 |
| Insurance | -$125 | -$1,500 |
| Property management (8%) | -$168 | -$2,016 |
| Maintenance (1.5% of value) | -$250 | -$3,000 |
| CapEx reserves (8% of rent) | -$168 | -$2,016 |
| Mortgage (P&I) | -$1,011 | -$12,132 |
| Monthly cash flow | $65 | $776 |
Positive cash flow, but barely. One unexpected repair or an extra month of vacancy wipes out the entire year’s profit.
This exercise illustrates why running the numbers matters. Small changes in purchase price, rent, or interest rate dramatically shift a property from profitable to unprofitable.
What’s a good monthly cash flow? Most experienced investors target a minimum of $100 to $200 per month per unit after all expenses. Conservative investors aim for $200 to $300+. Anything below $100 per unit leaves too little margin for unexpected costs.
Metric 2: Cash-on-Cash Return (CoC)
What it answers: What percentage return am I earning on the actual cash I invested?
Cash-on-cash return measures the annual pre-tax cash flow as a percentage of the total cash you put into the deal. This is the metric that lets you compare rental property returns to other investments like stocks, bonds, or REITs.
Formula:
Cash-on-cash return = (Annual pre-tax cash flow ÷ Total cash invested) × 100
Total cash invested includes:
- Down payment
- Closing costs
- Immediate repair/renovation costs
Example:
Using the third scenario above ($200,000 purchase, $2,100 rent, $776 annual cash flow):
- Down payment (20%): $40,000
- Closing costs (3%): $6,000
- Immediate repairs: $5,000
- Total cash invested: $51,000
Cash-on-cash return = ($776 ÷ $51,000) × 100 = 1.52%
A 1.52% cash-on-cash return is poor. You could earn more in a high-yield savings account with zero risk and zero effort. This deal doesn’t make financial sense as a pure cash flow investment.
What’s a good cash-on-cash return? Target a minimum of 8% to 10%. Strong deals produce 10% to 15%. Exceptional deals in certain markets can produce 15% to 20%+, though these are increasingly rare in competitive markets.
Let’s reverse-engineer what this property would need to produce a 10% CoC return:
10% of $51,000 = $5,100 annual cash flow needed
$5,100 ÷ 12 = $425 monthly cash flow needed
Working backward from the expense structure, you’d need to either buy the property for significantly less, charge significantly higher rent, or find a way to reduce expenses meaningfully. If none of those are realistic, the deal doesn’t work.
Metric 3: Cap Rate (Capitalization Rate)
What it answers: What return does the property generate based on its purchase price, ignoring financing?
Cap rate strips out the mortgage entirely and looks at the property’s income performance on its own. This makes it useful for comparing properties with different financing structures, or for evaluating what a property earns if purchased with all cash.
Formula:
Cap rate = (Net Operating Income ÷ Purchase price) × 100
Net Operating Income (NOI) = Effective gross income – All operating expenses (not including mortgage payments)
Example:
Using the $200,000 property with $2,100 rent:
Effective gross income: $25,200 – $1,260 (vacancy) = $23,940
Operating expenses:
- Property taxes: $2,500
- Insurance: $1,500
- Property management: $2,016
- Maintenance: $3,000
- CapEx reserves: $2,016
- Total operating expenses: $11,032
NOI = $23,940 – $11,032 = $12,908
Cap rate = ($12,908 ÷ $200,000) × 100 = 6.45%
What’s a good cap rate? This varies significantly by market. In expensive coastal cities (San Francisco, New York, Los Angeles), cap rates of 3% to 5% are common. In mid-sized and smaller markets, cap rates of 6% to 10% are typical. In rural or economically weaker areas, cap rates above 10% are possible but often come with higher risk.
A higher cap rate means the property generates more income relative to its price. But cap rates don’t exist in a vacuum. A 12% cap rate in a declining market with high crime might be riskier than a 5% cap rate in a stable, growing city.
Use cap rate primarily for comparing properties within the same market. Two properties in the same neighborhood with cap rates of 5.5% and 7.2% tell you which one is priced more favorably relative to its income. Comparing cap rates between completely different markets is less meaningful because the risk profiles are different.
Metric 4: The 1% Rule (and Why It’s Just a Starting Point)
What it answers: Does this property pass a quick initial screening test?
The 1% rule says a rental property’s monthly rent should be at least 1% of the purchase price. A $200,000 property should rent for at least $2,000 per month. A $300,000 property should rent for at least $3,000.
Example:
$200,000 property renting for $2,100/month: $2,100 ÷ $200,000 = 1.05%. Passes the 1% rule.
$250,000 property renting for $1,800/month: $1,800 ÷ $250,000 = 0.72%. Fails the 1% rule.
Why it’s useful: The 1% rule gives you a five-second screening tool. If a property doesn’t come close to 1%, the math is very unlikely to work, and you can move on without spending hours on detailed analysis.
Why it’s just a starting point: The 1% rule ignores property taxes (which vary enormously by state), insurance costs, HOA fees, the condition of the property, and the interest rate environment. A property that passes the 1% rule in a high-tax state with expensive insurance might still lose money. A property that fails the 1% rule in a low-tax state with strong appreciation potential might still be a worthwhile investment.
Use the 1% rule to filter quickly. Use the detailed calculations above to make actual decisions.
In the current interest rate environment, properties meeting the 1% rule have become harder to find in many markets. Some investors have adjusted their screening to 0.8% or 0.7% in appreciation-focused markets, accepting lower cash flow in exchange for property value growth. This is a valid strategy, but it changes the risk profile and requires longer time horizons to generate returns.
Metric 5: Gross Rent Multiplier (GRM)
What it answers: How many years of gross rent would it take to pay off the purchase price?
GRM is a quick-comparison metric that helps you evaluate pricing relative to income across multiple properties.
Formula:
GRM = Purchase price ÷ Annual gross rent
Example:
$200,000 property with $2,100/month rent ($25,200/year):
GRM = $200,000 ÷ $25,200 = 7.94
$250,000 property with $1,800/month rent ($21,600/year):
GRM = $250,000 ÷ $21,600 = 11.57
The lower the GRM, the faster the property’s gross rent “pays for” the purchase price, and generally the better the deal.
What’s a good GRM? For income-focused investors, a GRM below 8 to 10 is typically attractive. Above 12 to 15 signals an expensive property relative to its income. Like cap rate, GRM varies by market and property type.
GRM has the same limitation as the 1% rule: it ignores expenses. But it’s faster to calculate than cap rate and useful for comparing multiple properties at a glance before running full analyses on your best candidates.
Metric 6: Debt Service Coverage Ratio (DSCR)
What it answers: Can this property’s income comfortably cover its mortgage payments?
DSCR measures how much cushion exists between the property’s net operating income and its debt payments. Lenders use this metric to evaluate risk. Investors should use it too.
Formula:
DSCR = Net Operating Income ÷ Annual debt service (mortgage payments)
Example:
NOI: $12,908 (from our earlier example)
Annual mortgage payments: $12,132
DSCR = $12,908 ÷ $12,132 = 1.06
A DSCR of 1.06 means the property’s income barely covers the mortgage with only 6% cushion. One bad month, one vacancy period, one unexpected repair, and the property can’t cover its debt.
What’s a good DSCR? Lenders typically require a minimum DSCR of 1.20 to 1.25 for investment property loans. As an investor, aim for 1.25 or higher. A DSCR below 1.0 means the property doesn’t generate enough income to cover the mortgage, and you’re paying out of pocket every month.
The Full Deal Analysis: Putting It All Together
Let’s walk through a complete deal analysis using a realistic example, tracking every number from initial evaluation to final decision.
The Property
- Listing price: $225,000
- Property type: 3-bed, 2-bath single-family home
- Year built: 1998
- Condition: Good, needs minor cosmetic updates ($3,000 estimated)
- Location: Suburban neighborhood in a mid-sized city with a growing job market
- Current tenant: In place paying $1,750/month, lease expires in 8 months
Step 1: Verify Market Rent
You check five comparable active rentals in the same neighborhood:
- 3/2 on Oak Street: $1,850/month
- 3/2 on Maple Avenue: $1,900/month (recently renovated)
- 3/2 on Elm Drive: $1,795/month
- 3/1.5 on Pine Road: $1,700/month
- 3/2 on Cedar Lane: $1,825/month
Conclusion: market rent for this property in its current condition is approximately $1,800/month. After $3,000 in cosmetic updates (when the current lease expires), you could push to $1,850 to $1,900. Use $1,800 for conservative analysis.
Step 2: Calculate Acquisition Costs
- Purchase price: $225,000
- Closing costs (3%): $6,750
- Inspection: $450
- Cosmetic updates: $3,000
- Total acquisition cost: $235,200
- Down payment (20%): $45,000
- Total cash out of pocket: $55,200 (down payment + closing costs + inspection + repairs)
Step 3: Calculate Operating Expenses
| Expense | Monthly | Annual |
|---|---|---|
| Property taxes (verified with county) | $229 | $2,750 |
| Insurance (quote from agent) | $142 | $1,700 |
| Property management (8%) | $144 | $1,728 |
| Maintenance (1.5% of value) | $281 | $3,375 |
| CapEx reserves (8% of rent) | $144 | $1,728 |
| Total operating expenses | $940 | $11,281 |
Step 4: Calculate Financing
- Loan amount: $180,000 (80% of $225,000)
- Interest rate: 6.75% (30-year fixed)
- Monthly P&I payment: $1,168
- Annual debt service: $14,016
Step 5: Calculate All Metrics
Effective Gross Income:
$1,800 × 12 × 0.95 = $20,520
NOI:
$20,520 – $11,281 = $9,239
Monthly Cash Flow:
$1,800 – $90 (vacancy) – $940 (operating expenses) – $1,168 (mortgage) = -$398
Annual Cash Flow:
-$398 × 12 = -$4,776
Cash-on-Cash Return:
-$4,776 ÷ $55,200 = -8.65%
Cap Rate:
$9,239 ÷ $225,000 = 4.11%
1% Rule:
$1,800 ÷ $225,000 = 0.80% (fails)
GRM:
$225,000 ÷ $21,600 = 10.42
DSCR:
$9,239 ÷ $14,016 = 0.66
Step 6: Evaluate the Results
The picture is clear. This deal doesn’t work at the listed price and current financing terms.
- Cash flow is negative $398 per month. You’d be paying nearly $400 out of pocket every month to own this property.
- Cash-on-cash return is deeply negative.
- The 1% rule fails at 0.80%.
- DSCR of 0.66 means the property generates only 66% of the income needed to cover the mortgage. This is a red flag that a lender may not even approve.
- Cap rate of 4.11% is below average for a mid-sized market.
Step 7: Find the Price That Works
This is where analysis becomes negotiation power. What price would make this deal work?
Target: $200/month positive cash flow, which requires approximately $7,176 in annual cash flow improvement from the current -$4,776.
Options:
- Lower purchase price: Each $10,000 reduction in purchase price reduces the mortgage payment by approximately $65/month and reduces property tax and maintenance estimates slightly. You’d need to negotiate roughly $40,000 to $50,000 off the asking price to reach positive cash flow, bringing the purchase price to $175,000 to $185,000.
- Higher rent: If comparable rents support $2,100/month instead of $1,800, that adds $300/month ($3,600/year) and dramatically improves every metric. But rent has to be based on market reality, not wishful thinking.
- Lower interest rate: Each 0.5% reduction in interest rate saves approximately $55/month on a $180,000 loan. Waiting for rates to drop or finding a seller willing to offer seller financing at a lower rate could improve the math.
- Reduce expenses: Self-managing (eliminating the 8% management fee) saves $144/month. But you should analyze deals assuming professional management, because self-management is a labor contribution, not a financial return.
If you can’t realistically achieve any of these adjustments, walk away. There will be other properties. There won’t be more money if you buy a deal that bleeds cash.
The Hidden Returns: Equity Buildup and Appreciation
Cash flow is the return you see in your bank account every month. But rental properties generate returns you don’t see immediately. Ignoring these hidden returns leads to overly pessimistic analysis. Counting on them exclusively leads to dangerous speculation. The truth lives in between.
Mortgage Principal Paydown
Every mortgage payment is split between interest (which is a pure cost) and principal (which reduces your loan balance and builds your equity). In the early years of a 30-year mortgage, most of the payment goes to interest. Over time, the split gradually shifts toward principal.
Using our $180,000 loan at 6.75% example:
- Year 1: Approximately $2,016 of your $14,016 in annual payments goes to principal reduction
- Year 5: Approximately $2,688 goes to principal
- Year 10: Approximately $3,816 goes to principal
- Year 20: Approximately $7,236 goes to principal
This principal paydown is a real return on your investment. After 10 years, you’ve paid down roughly $26,000 of your loan balance, equity that you’d realize when you sell or refinance. After 30 years, the entire loan is paid off, and you own the property free and clear.
When you include principal paydown in your total return calculation, a property with modest positive cash flow looks much better. $100/month in cash flow plus $200/month in principal paydown equals $300/month in total equity building.
The caution: Principal paydown isn’t liquid. You can’t spend it until you sell or refinance. And if property values decline, your equity can shrink even as you pay down the loan. Count principal paydown as a return, but don’t depend on it for your monthly finances.
Property Appreciation
Historically, U.S. residential real estate has appreciated at roughly 3% to 4% per year on average, though this varies enormously by market and time period. Some markets have seen 8% to 10% annual appreciation for extended stretches. Others have gone flat or declined for years.
On a $225,000 property appreciating at 3% annually:
- After 5 years: Worth approximately $260,800 ($35,800 gain)
- After 10 years: Worth approximately $302,400 ($77,400 gain)
- After 20 years: Worth approximately $406,600 ($181,600 gain)
These gains are amplified by leverage. If you put $45,000 down on a property that appreciates $35,800 in five years, that’s a 79.5% return on your down payment from appreciation alone, before counting any cash flow or principal paydown.
The caution: Appreciation is not guaranteed. Buying a property that loses money every month and counting on appreciation to bail you out is speculation, not investing. Markets correct. Local economies shift. Neighborhoods decline.
The smart approach: analyze every deal assuming zero appreciation. If the deal works without appreciation (positive cash flow, reasonable cash-on-cash return), then appreciation is a bonus that accelerates your wealth building. If the deal only works with aggressive appreciation assumptions, the risk is too high.
Total Return: The Complete Picture
Experienced investors look at total return, which combines all four sources of rental property income:
- Cash flow (monthly income after all expenses)
- Principal paydown (equity built through mortgage payments)
- Appreciation (increase in property value)
- Tax benefits (depreciation deductions, mortgage interest deductions, and other tax advantages)
Total return example using a property with modest numbers:
- Annual cash flow: $2,400
- Annual principal paydown: $2,400
- Annual appreciation (3%): $6,000 on a $200,000 property
- Annual tax savings (estimated): $1,200
- Total annual return: $12,000
On a $55,000 total cash investment, that’s a 21.8% total return.
This is why experienced investors sometimes accept thin cash flow margins. The total return, including invisible equity building and appreciation, can still be attractive even when monthly cash flow is modest.
But two warnings:
- Cash flow pays the bills. Total return doesn’t. If cash flow is negative, you’re writing checks every month regardless of what’s happening with equity and appreciation. Make sure you can comfortably afford any negative cash flow position.
- Only cash flow and tax benefits are realized annually. Principal paydown and appreciation are paper returns until you sell or refinance. A property with amazing total returns but negative cash flow requires you to subsidize it from other income every month. Make sure that’s a conscious choice, not an accidental one.
Tax Benefits: The Math Most Investors Miss
Real estate offers tax advantages that meaningfully improve your after-tax returns. Understanding them is part of running complete numbers on any deal.
Depreciation
The IRS allows you to depreciate residential rental property over 27.5 years. This means you can deduct a portion of the property’s value (excluding land) from your taxable rental income each year, even though the property may actually be increasing in value.
Example:
- Property purchase price: $200,000
- Estimated land value: $40,000 (varies by location)
- Depreciable building value: $160,000
- Annual depreciation deduction: $160,000 ÷ 27.5 = $5,818
If your rental income minus cash expenses produces $3,000 in taxable income, the $5,818 depreciation deduction creates a $2,818 tax loss on paper. If you’re in the 24% tax bracket and qualify to deduct rental losses against your other income, that’s $676 in tax savings, real money that improves your effective return.
Qualification note: Your ability to deduct rental losses against W-2 or other income depends on your adjusted gross income and your level of active participation in the rental activity. Investors with modified adjusted gross income under $100,000 who actively participate can deduct up to $25,000 in rental losses. The deduction phases out between $100,000 and $150,000. Above $150,000, losses are generally passive and can only offset other passive income (unless you qualify as a real estate professional).
Consult a tax professional for your specific situation. Tax rules around rental real estate are complex, and the deductions can be substantial when properly applied.
Deductible Expenses
Nearly every expense associated with owning and operating a rental property is tax-deductible:
- Mortgage interest
- Property taxes
- Insurance premiums
- Property management fees
- Maintenance and repair costs
- Advertising for tenants
- Legal and accounting fees
- Travel to and from the property for management purposes
- Home office expenses (if you manage properties from home)
These deductions reduce your taxable rental income, often to zero or below, even when the property generates positive cash flow. This is the power of real estate taxation: you can receive cash income while reporting a tax loss.
1031 Exchange
When you sell a rental property at a profit, you’d normally owe capital gains tax on the gain. A 1031 exchange lets you defer that tax by reinvesting the proceeds into another qualifying investment property within specific timeframes.
This mechanism allows investors to sell properties, upgrade to larger or better-performing ones, and defer taxes indefinitely. Some investors use sequential 1031 exchanges over decades, building substantial real estate portfolios without ever paying capital gains tax on the growth.
The basic rules:
- The replacement property must be of equal or greater value
- You must identify a replacement property within 45 days of selling
- You must close on the replacement property within 180 days
- The exchange must be handled by a qualified intermediary
1031 exchanges are powerful wealth-building tools, but they require precise execution. Work with an experienced real estate attorney or tax advisor.
Stress Testing Your Deal: What Happens When Things Go Wrong
A deal that works perfectly on paper might fail in reality. Stress testing means asking “what if?” questions and running the numbers under worse-than-expected conditions.
Stress Test 1: Extended Vacancy
What if your property sits empty for three months instead of the two to three weeks you budgeted? Calculate the cash flow impact of losing three months of rent.
$1,800 × 3 = $5,400 in lost rent
If your annual cash flow was $2,400, a three-month vacancy puts you at -$3,000 for the year. Can you absorb that loss? Do you have reserves to cover the mortgage during the vacancy?
Stress Test 2: Major Repair
What if the HVAC system dies in Year 2? That’s a $5,000 to $8,000 expense. Do your CapEx reserves cover it? If not, can you pay for it without financial strain?
Stress Test 3: Rent Decline
What if the local economy softens and market rents drop 10%? Recalculate all your metrics with $1,620 rent instead of $1,800. Does the deal still produce positive cash flow?
Stress Test 4: Interest Rate on Refinance
If you’re using an adjustable-rate mortgage or planning to refinance, what happens if rates are 1% to 2% higher when your rate adjusts? Run the numbers with a higher payment.
Stress Test 5: Problem Tenant
What if a tenant stops paying rent and it takes three months to complete the eviction process? You’ve lost three months of rent plus legal fees ($2,000 to $5,000) plus potential property damage ($2,000 to $10,000). Does your financial cushion survive this scenario?
The reserve rule: Most experienced investors maintain a cash reserve of three to six months of total expenses (mortgage plus operating costs) per property. This reserve absorbs the financial shocks that inevitably occur in real estate investing. If you can’t maintain adequate reserves after purchasing a property, you’re over-leveraged.
The Expenses Beginners Always Forget
Even careful investors miss some costs. Here are the expenses that most commonly slip through the cracks of deal analysis.
Tenant turnover costs. When a tenant leaves, you typically face: cleaning ($200 to $400), painting ($500 to $1,500 for interior), minor repairs ($200 to $1,000), vacancy during marketing and screening (two to four weeks of lost rent), and tenant placement fees if using a property manager (50% to 100% of one month’s rent). A single turnover can cost $2,000 to $5,000+.
Lease-up period for new purchases. If the property is vacant when you buy it, you might not have a tenant for 30 to 60 days after closing. That’s one to two months of mortgage payments with zero income.
Lawn, pest control, and seasonal maintenance. These recurring costs are easy to overlook. Budget $100 to $250/month depending on property size and location.
Accounting and legal fees. Annual tax preparation for rental properties costs $200 to $500. Occasional legal consultations for lease reviews, eviction proceedings, or entity structuring add up.
Entity costs. If you hold properties in an LLC (recommended for liability protection), you’ll pay annual state registration fees ($50 to $500 depending on the state) and potentially higher insurance premiums.
Increasing expenses over time. Property taxes get reassessed. Insurance premiums rise. Maintenance costs increase as properties age. Your Year 1 expenses will be lower than your Year 5 expenses. Build in 2% to 3% annual expense growth to keep your projections realistic.
When to Walk Away from a Deal
The ability to say no is the most profitable skill in real estate investing. Here are the clear signals that a deal isn’t worth pursuing:
Negative cash flow with no clear path to positive. If the numbers don’t work at current rents and realistic expenses, and there’s no reasonable way to improve them (rent increases, expense reductions, value-add renovations), move on.
DSCR below 1.0. The property can’t cover its own debt. You’d be subsidizing the investment out of pocket every month.
Cap rate significantly below market average. You’re overpaying relative to the income the property generates.
Deferred maintenance that exceeds your budget. A property needing $40,000 in repairs might be a great deal at the right price, but only if you have the capital and the expertise to manage the renovation.
Location red flags. Declining population, rising crime, major employer leaving the area, or environmental issues (flood zones, contamination) that threaten long-term property values and rental demand.
Seller won’t provide financials. If the seller can’t or won’t share actual rent rolls, expense records, and maintenance history, something is being hidden. Don’t buy what you can’t verify.
The numbers only work with aggressive assumptions. If the deal requires 100% occupancy, above-market rents, below-average maintenance costs, or optimistic appreciation to produce a reasonable return, the deal doesn’t actually work. Conservative assumptions protect your money. Optimistic assumptions spend it.
Building Your Analysis System
Once you’ve evaluated a few properties, you’ll want a repeatable system that makes analysis faster and more consistent.
Create a spreadsheet template. Build a spreadsheet with input cells for every variable (purchase price, rent, taxes, insurance, management percentage, maintenance percentage, vacancy rate, loan terms) and formulas that automatically calculate all metrics (cash flow, CoC, cap rate, DSCR, GRM, 1% rule). Once built, you can analyze a new deal in 10 to 15 minutes by changing the inputs.
Save your assumptions. Document the default percentages and estimates you use (vacancy rate, maintenance percentage, CapEx percentage, closing cost percentage). This keeps your analyses consistent and lets you adjust when you learn that your assumptions were too conservative or aggressive.
Keep records of every deal you analyze. Whether you buy or pass, save the analysis. Over time, you’ll build pattern recognition: you’ll see which neighborhoods produce better numbers, which property types work in your market, and which price points hit your return targets.
Revisit and refine. After you own a property for a year, compare your projected numbers to actual performance. Where were you accurate? Where were you off? Adjust your assumptions for future analyses based on real-world results.
The Mindset Behind Good Rental Property Math
Numbers don’t lie, but they can mislead if you approach them with the wrong mindset.
Be conservative with income estimates and generous with expense estimates. If comparable rents range from $1,700 to $1,900, use $1,750 in your analysis, not $1,900. If maintenance could be 1% to 2% of property value, use 1.5% or 2%. This builds a margin of safety into every deal.
Separate emotions from analysis. The charming craftsman bungalow with the gorgeous garden might be a terrible investment. The boring beige ranch house on a bland street might be a cash flow machine. Let the math decide, not your aesthetic preferences.
Analyze 100 deals to buy one. This ratio isn’t literal, but the principle is real. Most properties you evaluate won’t meet your criteria. That’s the point. Disciplined analysis means only putting money into deals where the numbers genuinely work.
Treat your own time as a cost. Self-managing a property isn’t free. It’s labor you’re performing instead of paying someone else to perform. If self-managing saves $200/month in management fees but costs you 10 hours monthly, you’re earning $20/hour for that work. Is that the best use of your time? Include management fees in your analysis regardless of your management plans, and treat the savings from self-managing as a bonus, not a requirement for the deal to work.
Understand that no analysis eliminates all risk. Tenants default. Markets shift. Disasters happen. The goal of running the numbers isn’t to guarantee a profitable outcome. It’s to ensure you only take risks that offer adequate compensation. A deal with strong numbers can still lose money. But a deal with weak numbers will almost certainly lose money. The math doesn’t predict the future, but it dramatically improves the odds that the future works in your favor.
Every successful real estate investor runs the same calculations. The properties change. The markets change. The interest rates change. But the math stays the same, and the investors who trust it, who walk away from deals that feel right but calculate wrong, are the ones who build lasting wealth through real estate.
Run the numbers. Trust what they tell you. And never let excitement override arithmetic.